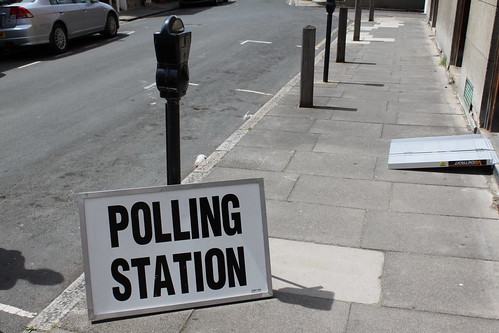
Whilst Labour took a drubbing nationally in the European elections, the borough of Greenwich stayed loyal with the party winning the popular vote albeit with a trimmed lead over the Conservatives.
At the 2004 European elections, Labour had a 10% lead over the Tories but this was cut to just 6% in Thursday’s vote, which was counted yesterday evening.
The LIberal Democrats and UKIP both saw their share of the vote decline whilst the Green Party and the BNP recorded increases.
Turnout in the borough was 32.44% – down slightly on the 34.90% turnout in 2004. The table below details the number of votes cast for the major parties against their previous performance.
| 2009 | 2004 | Change +/- | |
| Labour | 13,414 | 15,780 | -2,366 |
| Con | 10,360 | 10,428 | -68 |
| Lib Dem | 4,998 | 7,210 | -2,212 |
| UKIP | 6,507 | 8,470 | -1,963 |
| Green | 5,573 | 4,694 | 879 |
| BNP | 4,269 | 3,908 | 361 |
| Others | 5,510 | 3,839 | 1,671 |
The chart below shows the performance of the major parties verses their performance at the last European elections in 2004 in terms of percentage.

Greenwich Council has the full details of the vote in the borough.
